Guinness Global Energy Outlook for 2024

Growth Funds
10/01/2024
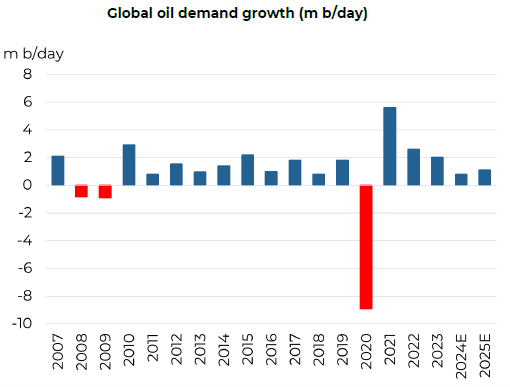
After several years of COVID-related disruption, 2024 brings more normalised conditions to oil markets. As ever, outcomes for spot oil prices in the short term are hard to predict, but it seems that the balance between demand and supply will be quite even. Global oil demand of around 1m b/day growth (as estimated by the International Energy Agency (IEA)) will be met by a combination of US shale, Guyana, Brazil and Canada, meaning that OPEC production is unlikely to grow meaningfully. We believe the oil price desired by OPEC is around $80/bl, though they will accept a higher outcome if it does not destabilise the global economy.
Will Riley
Jonathan Waghorn

Oil supply

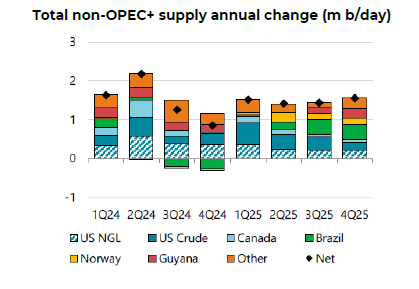
After a year of strong production growth in 2023, the world’s oil supply growth likely slows in 2024, led by lower activity in US onshore shale oil. Non-OPEC (ex US shale) will have some pockets of growth thanks to newer supply projects in Guyana and Brazil and new pipeline infrastructure in Canada, but the roster of new projects in the longer term still looks weak given lower (albeit increasing) levels of investment. In the face of further supply growth, OPEC+ has increased and extended quota reductions, thereby ceding market share, to sustain prices at a reasonable level. 

Source: International Energy Agency (IEA), December 2023

OPEC+ oil supply

OPEC+, led by Saudi, will continue their micromanagement of the oil market in 2024, trying to defend a reasonable price via supply discipline. The December 2023 OPEC+ meeting resulted in quota changes that we estimate will bring an actual production decline of around 0.4-0.5m b/day. This is lower than the headline quota cut of 2m+ b/day, since it already included the bilateral cuts implemented by Saudi and Russia in the summer of 2023, plus adjustments to some quotas where underlying production is already underperforming. The cuts are designed to balance the market in 1Q 2024, but Saudi energy minister Prince Abdulaziz bin Salman explained that the cuts “absolutely” can continue past the first quarter if needed, depending upon the seasonal demand trajectory. Critical to the success of this plan are Iraq, Kuwait and UAE, which need to cut November 2023 production levels by 0.3m b/day, 0.2m b/day and 0.4m b/day respectively to be compliant.

The next full ministerial conference takes place on 1 June 2024 in Vienna and may include Brazil as a member of OPEC+. If so, Brazil would participate along the lines of Mexico, which does not take part in the group’s supply cuts. Brazil is on track to raise output by 350k b/day this year to a record 3.5m b/day.

For 2024, the ‘call on OPEC’ is 27.6m b/day, slightly lower than the 2023 level (as non-OPEC growth continues to surprise to the upside) but in line with most recent production levels. Assuming quota compliance, we will see a fairly balanced market in the first half of the year, followed by undersupply in the second half, leading to a significant inventory draw. This will position the OPEC+ group to add supply back into the market, should they choose.

Source: Bloomberg; IEA; Guinness Global Investors; December 2023

We expect continued flexibility from OPEC+, particularly Saudi, in 2024 to adjust production and put a ‘soft’ floor under oil prices should oil demand falter. However, Saudi is producing at its lowest sustained level since 2018 and the market share of OPEC+ (51% in 2023) is at the lowest level since the group’s inception in 2016, meaning it will likely be more challenging for the group in 2024 than it was in 2023. 

The key variables to OPEC+ production in 2024 and beyond are Russia, Venezuela and Iran.

  • Despite production holding up better than expected, Russian government oil and gas revenues were down around 50% in 2023. This year, Russia can either ignore quotas and keep production as high as possible or fall into line with OPEC+ in the hope that oil prices rise. We believe Saudi are pressuring Russia to pursue the latter course, and Russia appear to be toeing the line. Lower revenues for Russian oil companies mean that their longer-term planned production growth is unlikely to surface.
  • Production from Iran could be affected by both foreign policy and the potential for the country to become embroiled in the Israel/Hamas conflict. If a nuclear sanctions deal can be achieved with the US, it opens to the door to around 0.5m b/day of additional exports, but not much more, given the recovery in Iranian exports already achieved in 2023. A major escalation of the existing conflict beyond Israel and Hamas, with Iran becoming directly involved, would have more serious implications for the oil market. Iran is not only a material oil producer (currently just over 3m b/day) but it could attempt to block the Straits of Hormuz (something that has happened in the past) thereby jeopardizing the flow of around 20m b/day of crude oil, condensate and refined products that pass through each day.
  • Venezuela appears to have finally stemmed a long-running production decline, with crude oil production rising for a third straight year to reach nearly 0.8m b/day in 2023 (still down nearly 70% on the 2014 levels of nearly 2.5m b/day). Further small gains likely come in 2024 after the US announced a six-month easing of sanctions on the oil sector which allows the country to produce and export oil to its chosen markets without limit.

Overall, we believe that Saudi’s long-term objective remains to maintain a ‘good’ oil price, as close to their fiscal breakeven of around $80/bl as possible, without overstimulating non-OPEC supply. Allowing for inflation, the defending of $80/bl in 2024 is the same in real terms as the group’s actions in 2006-2008 when they defended a nominal price of around $60/bl. With oil prices at more comfortable levels for the group, we would now expect government expenditures to steadily pick up and for the ‘breakeven oil price’ metric to trend higher in the coming years.
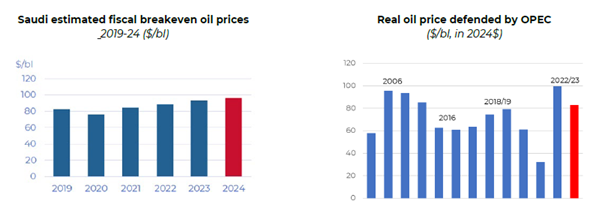
Sources: IMF; DNB, Guinness Global Investors; December 2023. *’Breakeven oil price’ is defined as the oil price needed by Saudi to balance its fiscal budget. 

Ultimately, the equation which drives OPEC+’s actions here is one of revenue maximisation. The calculation is that the percentage drop in sold oil volumes across the group is likely to result in a greater percentage increase in oil prices, thereby driving higher overall revenues in the short term and extending OPEC’s reserve life.

For Saudi specifically, their actions at the head of the group have been designed to achieve an oil price that avoids fiscal deficit whilst not spiking the oil price too high and over-stimulating non-OPEC supply.

US onshore (shale) oil supply

For much of the last decade, growth in the US shale industry had been responsible for keeping global oil markets well supplied, forcing OPEC and its allies to hold some of their production back to achieve a stable market. Latest data for October 2023 from the US Energy Information Administration (EIA) confirmed production of 10.9m b/day, surpassing the pre-COVID peak (November 2019) of 10.5m b/day.

Source: EIA; Bloomberg; Guinness Global Investors, as of October 2023

The previous cycle of production growth, between 2016 and 2019, was achieved thanks to near limitless funding from equity and debt markets, combined with a producer mentality that favoured growth over returns. By contrast, the rebound in US shale oil production growth since 2020 has been more modest because of lower drilling activity (due to greater capital discipline from E&P companies, inflation and higher interest rates) and some initial signs of degrading resource quality.

Capital discipline appears to be the main driver of lower activity levels, with around 65% of compensation incentives for E&P management teams now being driven by profitability, cash flow and operational metrics (such as cost reduction) versus only 44% in 2014. By contrast, growth in reserves and production now represent only 6% of incentives versus 26% back in 2014.

Resource degradation remains unclear as the best inventory has increasingly been ‘drilled out’ and producers have turned to second-tier acreage. There was conflicting data on this topic in 2023, but the signs are that efficiency and productivity gains from recent years are likely near an end, although emerging cost deflation could act as an offsetting factor. Most recent data for October 2023 showed oil production per new US shale oil well starting to pick back up, having reduced steadily over the prior 18 months.

Source: DNB, December 2023

Total US shale supply in 2024 will be heavily impacted by the activity and performance of the Permian Basin, which delivers 6m b/day of oil production (56% of total US onshore oil production). For context, the Permian basin has grown oil production by 4m b/day in the last seven years and, according to Enervus, still has 80,000 geologically viable drilling locations that are economic below $75/bl Brent oil prices. Recent drilling activity (oil rig count at 314 rigs, down 10% from the mid-2023 peak) implies that the near-term growth outlook will be more muted, reflecting the increased capital discipline of key acreage owners. Against this, recent M&A activity (such as ExxonMobil and Occidental buying Permian pureplay E&Ps Pioneer Natural Resources and CrownRock) is likely to impact the outlook as more capital is made available for drilling and fracking. 

Overall, we see a muted growth outlook in 2024 for US shale oil, with growth of around 0.4m b/day versus 2023. The bulk of the industry will persist in its focus on free cashflow yields, deleveraging, increasing returns to shareholders and consolidation. Our expectation for growth in 2024 is lower than 2023 (c.0.8m b/day) and significantly less than the annual average from 2017-19.

Looking longer-term, US onshore oil (shale) supply likely continues to grow for the next five years with the Permian providing the lion’s share. While unlikely to impact 2024 production, a Republican victory at the end of 2024 could usher in looser regulations on US shale oil. This would act as a catalyst for investment across the US onshore shale patch, though is unlikely to derail the industry’s focus on free cashflow over growth.

Ultimately, US supply will continue to be watched closely by OPEC. If shale oil grows at a manageable level – a level that does not exceed (normalised) global oil demand growth – then OPEC will feel they retain control of the market.

Non-OPEC (ex US onshore) oil supply

Non-OPEC (ex US onshore) oil supply is likely to grow around 0.8m b/day in 2024, having grown by 1.4m b/day in 2023, thereby reaching a new high of 58.1m b/day in 2024.

After a sustained period of underinvestment in the non-OPEC world (ex US shale), capital spending is starting to pick up again, with money in particular being directed towards deepwater projects in Brazil and Guyana. This increase in investment follows the typical 12-18 month time lag between movements in the oil price and upstream investment, but the absolute level of investment still remains subdued. 

Looking back over the last few years, the low level of capital expenditure being committed for the largest non-OPEC oil projects around the world in 2016-21 (averaging around $35bn, compared to around $100bn in 2010-14) is likely to lead to anaemic growth or stagnation in non-OPEC (ex US onshore) supply in the near term and for some time to come. And considering the oil cost curve, it appears that industry inflation, higher taxes and an increasing cost of capital for hydrocarbon projects have pushed the marginal incentive price (i.e. 75th percentile of the cost curve) to around $80/bl, up from $70/bl a year or two ago.

Source: Morgan Stanley; December 2023

According to Goldman Sachs, seven years of low investment in oil exploration have seen the industry’s reserve life for large projects fall since 2013 by 56% to 23 years. Large projects still need to come through to replace existing oil supply that is in natural decline.

Regionally in 2024, we expect Canada, Guyana and Brazil to be the most significant areas of non-OPEC (ex US onshore):

  • Canada will continue to recover from its 2020 slump with growth coming from optimisation and debottlenecking of operations at oil sands projects rather than new capital projects. Takeaway capacity constraints for Albertan producers will disappear when the 590k b/day Trans Mountain Expansion Project (TMX) starts up in 2Q 2024.
  • Brazil will likely grow a further 0.3m b/day to reach 3.8m b/day in 2024. The Brazilian growth journey likely continues beyond this as a total of 10 new FPSOs (floating production storage and offloading vessels) are planned by 2028 bringing the total to 15 new FPSOs for the 2022-2028 period (around half of the world’s FPSOs put in operation over this timeframe).
  • The long-term growth trend from Guyana will also continue, potentially adding 0.2m b/day in 2024 as Payara (the third development phase of the 11bn barrel Stabroek block) ramps to a production plateau. Three more phases are planned over the next six years, bringing total capacity to approximately 1.2m b/day. This assumes no disruption will be caused in coming years by the Venezuelan referendum which supported expropriating the Essequibo region (which includes the majority of the Stabroek block) from Guyana.

Oil demand

According to recent estimates from the IEA, global oil demand for 2023 rose by around 2.2m b/day.  This compares to forecast growth at the start of last year of 1.7m b/day.

Looking into 2024, the path for oil demand will vary region by region and product group with growth normalising as COVID-related distortions fade. The IEA estimate demand growth of 1.1m b/day with the non-OECD up by 1.3m b/day and the OECD down by 0.2m b/day.

Despite the continued recovery in 2023, global oil demand remains below its long-term trend, with 2024 demand likely to be around 3.5m b/day below the 106.3m b/day demand implied by the pre-COVID demand trend. OECD demand is around 1.2m b/day below trend, while non-OECD is around 2.3m b/day below. We discuss below reasons that contribute towards this sub-trend consumption, including depressed jet fuel demand, growth in remote working, global economic weakness, energy efficiency, and the growth of electric vehicles:

Source: IEA, Morgan Stanley, December 2023

  • Jet fuel demand for aviation remains the weakest oil product group relative to pre-COVID trends. The IEA expects 7.2m b/day of jet fuel demand in 2024 (flat on 2023) and 0.7m b/day below 2019 levels. Pre-COVID, jet fuel demand had been growing at a rate of around 0.2m b/day, implying that 2024 demand would have been around 1.7m b/day higher than is currently forecast. Longer-term, despite growth in remote working, we see good reason to expect that a large share of this pent-up aviation demand reappears.
  • Growth in remote working has accelerated since COVID but its negative impact on oil demand is likely to reduce further in 2024 to around 0.4m b/day, having been around 1.0m b/day in the depths of COVID. We expect its impact to remain around this level longer-term.
  • Below trend global economic growth. The IEA’s 1.1m b/day demand growth forecast is based on world GDP growth declining to 2.6% in 2024 from an already below-trend level of 3% in 2023. Within this, China (which has accounted for half of world oil demand growth over the last 20 years) is forecast to fall from 5% to 4.2% and the current broader economic weakness in Europe, Russia and the Middle East leads to weaker demand estimates for 2024. Easing in consumer inflation and therefore interest rates across developed economies would likely result in an improved GDP and therefore a stronger oil demand growth outlook. 
  • Electric vehicles. Given how much EVs are talked about, there is a danger of overestimating the impact of road transport electrification on global oil demand. Cars and light trucks account for around 25% of global oil usage, with heavy vehicles accounting for around 15%. We estimate that electric vehicles will have a cumulative impact of around 0.8m b/day on global demand in 2024 and will likely erode oil demand by c.0.3 m b/day each year in the next few years.

    Despite these factors, 2024 oil demand of 102.8m b/day will be around 2m b/day above its previous peak in 2019. Regionally in 2024, we see China delivering the largest oil demand growth of 0.8m b/day (taking overall demand to a new high of 17.2m b/day) and India in a distant second place delivering just over 0.1m b/day (down from a strong 2021-2023 oil demand growth rate of 0.3m b/day). We refer here to IEA estimates but note divergent opinions between the key forecasting agencies on 2024 oil demand; OPEC forecasts 104.4m b/day, implying demand growth of around 2.3m b/day in 2024.

Source: IEA, Guinness Global Investors; December 2023

Globally, we believe that oil remains a ‘good value’ commodity. Based on Brent oil price of around $80/bl in 2024, we calculate that the world would spend around 2.8% of GDP on oil, below the 30-year average of around 3% and well below the 3.8% seen in 2010 when oil also averaged $80/bl. We believe that oil would need to increase to around $150/bl, reflecting 5.3% of world GDP in 2024, if it were to have a noticeable negative impact on the global economy. 

Source: IEA, Bloomberg, Guinness Global Investors; December 2023

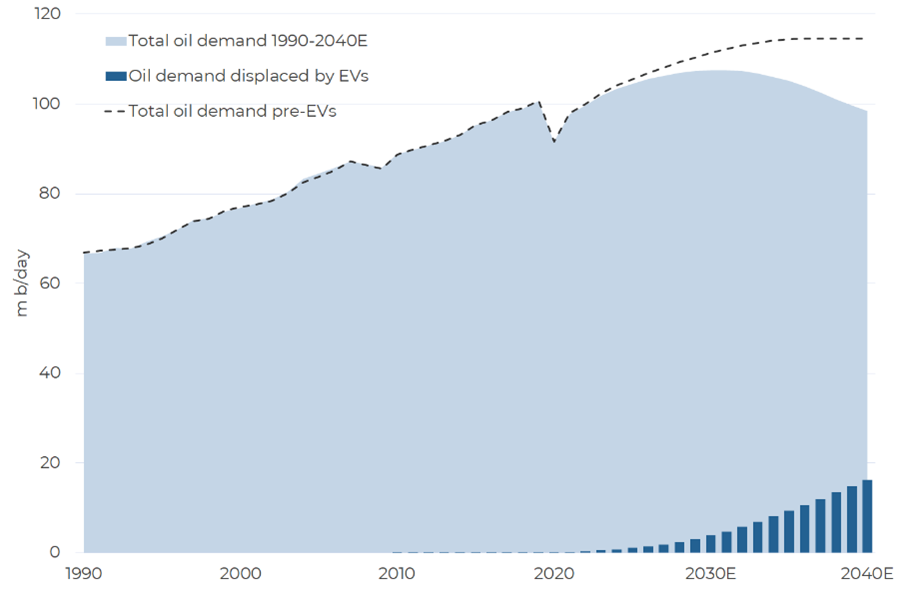
Looking beyond 2024, when will oil demand peak? Our assumptions for EV adoption see around 4-5m b/day of oil demand displaced globally by 2030, growing to 13-15m b/day of oil demand displaced by 2040. However, our analysis of the other demand sources (for example aviation and the continued expansion of the petrochemical industry) implies continued growth in demand. Taken together, the most likely scenario for peak oil demand would be sometime around 2030, reaching a peak of somewhere between 105-110m b/day with Asia Pacific providing around 90% of the total growth. And despite rapid EV adoption around the world in the 2030s, oil will continue to be consumed at significant volume well beyond the 2030 peak. We expect oil demand in 2040 at 95-100m b/day, consistent with demand in the late 2010s.

Source BP Statistical Review for historic data, Guinness Global Investors estimates; December 2023

Oil inventories and conclusions

At October 2023, OECD oil and oil product inventories stood at an estimated 2.8bn barrels, around 44m barrels higher than October 2022 and around 9m barrels below the 10-year pre-COVID average.

The evolution of inventories in 2024 will be dynamic, depending on price, OPEC compliance, non-OPEC growth, strategic petroleum reserve movements, corporate behaviour and macro-economic factors. Our base case for 2024, making assumptions for the key sensitivities discussed in this report, is that the world oil market will by kept roughly in balance by OPEC, but with a greater prospect of market looseness in 1H 2024 followed by tighter conditions in 2H 2024.

Source: IEA, Guinness Global Investors; to 31.10.2023

Overall we believe that Saudi will continue to pursue its long-term objective of maintaining a ‘good’ oil price, as close to their fiscal breakeven of around $80/bl as possible. We model a Brent oil price of $80/bl for 2024 since this represents a world oil bill of around 2.8% of 2024 global GDP, comfortably below the average of the 1970 – 2015 period (3.4%). Lower non-OPEC supply growth in 2024 suggests that Saudi should be able to keep control of the market, but this will be more difficult than it was in 2023.

Beyond 2024, we feel that $80/bl is a sensible Brent oil price: one that allows world oil demand to continue to grow, incentivises an acceptable amount of non-OPEC and US onshore (shale) oil growth, and largely satisfies core OPEC budgetary requirements.

Natural Gas Markets

US natural gas 

The outlook for natural gas in the US in 2024 is likely to be defined by various factors:

  • A more muted underlying gas demand growth of 0.5 Bcf/day versus average growth of nearly 4 Bcf/day between 2021 and 2023. This is due to weaker power generation demand (-2.2 Bcf/day) offset by higher residential/commercial and industrial demand. Higher residential/commercial and industrial demand reflects overall strength in the US economy.
  • LNG exports rising to 13.7 Bcf/day for 2024 (+0.7 Bcf/day vs 2023) with the growth driven mostly by higher utilisation of Freeport LNG in 2024 (relative to 2023 when the facility was still returning to operation after an explosion) and to a lesser extent by the start of Venture Global’s Plaquemines Phase 1 LNG terminal towards the end of 2024. 
  • Lower supply growth from onshore properties as weaker natural gas prices have brought a lower rig count (down 25% to 120 rigs during 2023) and lower investment. A 10% reduction in rig count in the Permian also has a knock-on effect of reducing associated gas supply in 2024, while Haynesville production in 2024 may be down versus 2023. Growth in US onshore gas production of less than 1 Bcf/day in 2024 is in marked contrast to the average growth of over 3.3 Bcf/day achieved in the period 2018-2022.

Overall, at this stage of the year, we foresee a slightly undersupplied natural gas market although we note that US natural gas prices are dynamic and that activity can change rapidly depending on the demand trajectory and underlying weather patterns.

Source: EIA, Bloomberg, Goldman Sachs, Morgan Stanley, Guinness Global Investors estimates; December 2023

Beyond 2024, we expect to see a material increase in US LNG export capacity as higher international gas prices incentivise new LNG export investment. Proposed projects imply capacity growth of around 6-7 Bcf/day by the end of 2025 and a further 5-6 Bcf/day in 2026-2028, bringing total export capacity to around 25 Bcf/day by 2028 (versus LNG exports of 13 Bcf/day in 2023).

As mentioned above, Venture Global’s Plaquemines Phase 1 (1.6 Bcf/day) represents the most meaningful addition (in 2H 2024) although it is not expected to have a significant impact on overall LNG exports in the year. Cheniere’s Corpus Christi III is also due to commission before the end of the year and it too will not have commercial operations before 2025. Two additional new projects (Golden Pass with 2.4 Bcf/day and Plaquemines Phase 2 with 1.6 Bcf/day) will also enter service in 2025. Beyond that, the Rio Grande, Port Arthur, and Freeport Phase 2 Expansion schemes take overall LNG export capacity to around 25 Bcf/day by 2028, representing around 30% of current non-LNG US natural gas demand.

Source: JP Morgan, December 2023

The US natural gas price since 2010 has mainly fluctuated between $2 and $4/mcf. The extremes of this range have tended to coincide with warm and cold winters, and any sustained recovery over $3.50/mcf has generally been muted by strength in gas supply. With inflationary pressures, we estimate that new onshore supply has an incentive price of around $3.50/mcf. Assuming normal weather in 2024, we expect a Henry Hub price at around this level. 

International natural gas

Understanding the supply and demand dynamics of the global LNG market, which currently represents around 53 Bcf/day (or 403 mtpa) or roughly 13% of the global gas market, helps us to understand the outlook for international gas prices.

On the supply side, given the lead times in construction of new LNG facilities, we have good visibility on incremental liquefaction capacity. Over the next couple of years, LNG supply additions will be low (1-2% growth) until we start to see the ramp up of the next phase of Qatar LNG and the new US LNG facilities from 2025, adding over 90 mtpa of new supply. Indicative economics suggest these new LNG export projects will deliver LNG into European markets for between $10-14/mcf (compared to historical European natural gas prices of around $6-9/mcf pre-invasion). Current European and Asian natural gas prices are likely to be high enough to incentivise more capacity beyond this and we note a further 72 mtpa of LNG export projects are planning for development approval before the end of 2024. According to Morgan Stanley, global LNG capacity should be around 600mtpa by 2028.

Source: Morgan Stanley, December 2023

On the demand side, we consider Chinese and European LNG demand as being the two key non-weather related factors for 2024:

  • China imported 79mtpa of LNG in 2021 but only 63mtpa in 2022 as a result of COVID lockdowns and higher global LNG prices. Despite the Chinese economy re-opening, LNG demand is expected to register only a small increase in 2023 (up an estimated 8 mtpa) as China has ceded market share to Europe and turned instead to coal for electricity generation. Existing LNG import capacity is sufficient to allow LNG to grow in 2024 to new highs, which we expect to see.
  • Europe saw an estimated 20% reduction in natural gas demand in 2023 versus 2021, in response to high prices and sharp declines in Russian pipeline imports (which used to represent 45% of the supply mix). Digging into the demand reduction in 2023, we find that around half came from reduced heating while a third came from lower industrial demand, caused by higher gas prices. The reduction in heating demand was due to benign weather (2022 and 2023 have been particularly warm years) and there is scope for this to revert in a “normalised” 2023/2024 winter scenario (adding 12mtpa to LNG demand) or as much as 25mtpa in the event of a cold and windless winter. Around half of the reduction in industrial demand came from “production curtailment” – disproportionately from the ammonia and fertiliser sectors – and we think that these activities require a gas price of lower than $9/mcf to restart production. With European LNG prices still around $12/mcf, we expect minimal additional LNG demand rebound from industrial activities in 2024.

Europe has little opportunity to increase domestic gas production, so any recovery in demand will be met with higher LNG imports. European LNG import capacity is growing rapidly and is likely to reach 112 bcm a year by the of 2024 and 121 bcm in 2025 versus 57 bcm in 2022.

Natural gas inventory levels are critical indicators of the health of individual regional gas markets. A concerted effort to access additional gas to replace Russian volumes has allowed Europe to enter winter 2023/2024 with natural gas inventories essentially 100% full, although this has required prices to be around double the pre-COVID levels.

Source: DNB, December 2023

Putting it all together, we are left with the conclusion that the LNG market is going to be quite finely balanced over the next couple of years. In the event of moderate Chinese LNG demand and a “normal” European winter, LNG supply and demand appear to be roughly in balance, and global LNG prices appear to be fairly priced at around $12/mcf. However, stronger Asian demand (including South Korea and Japan as well as China) or a colder-than-expected European winter could easily see LNG in tight supply and cause international gas prices to spike this winter, although it is unlikely that they revert to the $40-$50 levels seen in winter 2022/2023. 

Looking further ahead, we see international gas prices settling in a $10-14/mcf range. This price range should be sufficient to incentivise new US and Qatari LNG supply sources to come online from 2025. It would also allow Europe to displace permanently almost all its Russian gas imports. An international gas price in the $10-14/mcf is well down on the highs seen in 2022, but would leave the market at a c.50% higher price point than in the few years prior to COVID and the Russian invasion of Ukraine.

Energy Equities

Falls in oil and natural gas prices, combined with a normalised refining environment, resulted in weaker relative returns for energy equities in 2023. The sector (MSCI World Energy Index) finished +2.5% in USD, well behind the broad market (MSCI World +23.9% in USD). The relative valuation of energy improved over the year and still appears attractive relative to the return on capital employed from the sector that we expect in coming years.

Moves in energy equities last year lifted the price-to-book (P/B) ratio for the energy sector at the end of December 2023 to around 1.7x, versus the S&P 500 trading at 4.5x. On a relative P/B basis versus the S&P500, therefore, the valuation of energy equities now sits at around 0.38x (down from 0.51x at the end of 2022), and still more than two standard deviations below the long-term relationship.
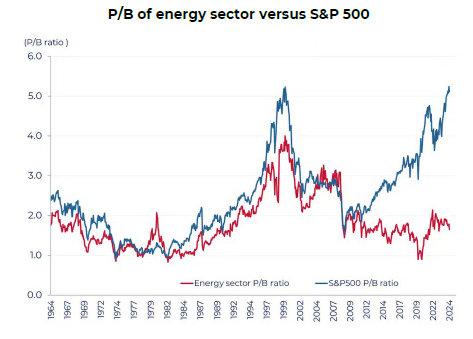
Sources: Bernstein Bloomberg Guinness Global Investors; December 2023

We keep a close eye on the relationship between the P/B ratio for the energy sector and return on capital employed (ROCE). Historically the two measures are closely correlated, a topic we return to later in this section. 

Continued importance of free cashflow in the sector

The capital allocation framework for oil & gas companies structurally changed in 2020, shifting emphasis from production growth to free cashflow and shareholder returns. Conditions in 2023 delivered robust levels of free cash, though dampened a little by energy service cost inflation. Companies providing preliminary 2024 outlooks have generally messaged a continued focus on returns over growth. We see this bringing higher free cashflows this year (even assuming flat oil & gas prices), driven by the tailwinds of efficiency improvements and service cost deflation. Across oil-weighted energy companies in North America, for example, we saw average free cashflow yields in 2023 of 10%. Assuming the oil price in 2024 averages the same as 2023, FCF yields are expected to rise to around 13%.

Source: MS, Guinness Global Investors; December 2023

For integrated oil & gas companies, one of the consequences of high free cashflow is strong dividend cover. Generally, we observe that periods of high dividend coverage in the energy sector coincide with outperformance versus broader equities. We saw this play out for much of the early to mid 2000s, when dividend coverage of 150%+ provided companies with the latitude to raise dividends consistently. By contrast, much of the relative bear market for energy equities post the financial crisis (i.e. the 2010s) coincided with dividend coverage at or below 100%, meaning dividends were only just covered or being paid for via the balance sheet. Since 2021, we have returned to a period of high dividend coverage, and assuming at least $75/bl Brent oil from 2024 onwards, we see coverage remaining at 200% or better. In these circumstances, we see good scope for continued dividend increases.

Source: Guinness Global Investors; December 2023

Return of M&A 

Large scale M&A returned to the oil & gas industry in 2023 with the announcement of several major deals. Most notably, Exxon announced the $60bn acquisition of Pioneer Natural Resources, followed soon after by Chevron announcing that it was buying Hess Corporation for $53bn. Both transactions, should they complete, will be the largest in the industry since Royal Dutch Shell acquired British rival BG Group in a $70bn deal in 2015. Globally, around $200bn worth of acquisition and merger deals have been announced in the oil & gas sector this year, the highest yearly total since 2014.

Source: Morgan Stanley

The Exxon/Pioneer deal is most relevant for our portfolio, with both companies owned. For Exxon, the deal represents a doubling-down for the company in shale oil production, in particular in the Permian Basin in Texas. The Permian is already a key pillar of Exxon’s upstream growth strategy (current production of around 0.6m boe/day, growing to 1m boe/day by 2027). The combined Exxon/Pioneer entity would produce around 1.3m boe/day today, with plans to grow to around 2m boe/day in 2027. At that point, the Permian would account for over one-third of Exxon’s total oil & gas production. 

Source: Guinness Global Investors, October 2023

The price being paid by Exxon for Pioneer ($253/share) implies a long-term oil price in the mid to high $70s/bl. Exxon are looking to achieve annual synergies of $2bn over the next decade, which would reduce the implied oil price towards $70/bl. Nevertheless, we find it encouraging that acquisitions are being sought at an implied oil price well above the $65/bl which we think is currently being discounted in our global energy portfolio.

More broadly, we think it is likely that consolidation in the US E&P sector continues (it appears that several public/public and public/private deals are currently being contemplated). And as ever, it will be those transactions that have clear strategic rationale, accretion to financial metrics and enhancement to inventory that are well received. US E&P sector consolidation is unlikely, though, to involve European majors, which appear set on a path that does not involve major expansion in US shale oil fields.

Energy transition among the oil & gas large-caps

The large integrated oil and gas companies historically have shown an ability and willingness to adapt to energy transitions. The latest transition is no different, with an acceleration of investments in and targets linked to low-carbon activities. The shift is far more marked for the EU large oil groups, with Exxon, Chevron and ConocoPhillips in the US lagging.

The route to lower carbon intensity for these companies is taking many forms, but the key transition activities are likely to be:

  • Significant expansion of low-carbon electricity divisions. This is likely to be a combination of renewable power capacity (solar; onshore & offshore wind) and growing retail energy and trading capabilities.
  • Expansion in petrochemicals. The petrochemicals industry is relevant to the net zero route in that it forms a non-combustion market for hydrocarbons.
  • Scaling up in biofuels. This will be a combination of renewable natural gas and renewable liquids, with various end markets particularly in power and transportation.
  • Carbon sequestration. As carbon capture activities ramp up, these should achieve better economies of scale.
  • Green hydrogen. Cleaner hydrogen is emerging as a key technology to decarbonise at the higher end of the cost curve, especially in power and gas-intensive industrial processes.

The pace and ambition of large-cap oil companies in their pursuit of renewable generation capacity varies considerably. By 2025, for example, it looks likely that Total and Repsol will be spending over 40% of their capital budgets on activities that will be deemed ‘green’ under EU taxonomy, whilst Shell and ENI will still be around 20%. 

Source: Goldman Sachs, Guinness Global Investors; December 2023

Amongst the European large-caps, it was notable in the middle of 2023 that both Shell and BP announced a slowing of their wind-down of oil & gas production. For Shell, the company maintained its target of spending $10-15bn over three years on low-carbon energy technology, representing around 20% of total group spending. However, spending on oil & gas production was raised to $40bn over the same period, with an ambition to maintain production at current levels until 2030, which contrasts with previous commitments to allow oil & gas output to fall. Meanwhile BP rowed back on its 2020 pledge to reduce its oil & gas production by 40% by 2030, with the company now anticipating a 25% reduction. Nonetheless, BP is still expected to have nearly 30% of its CAPEX in 2025 deemed ‘green’ under EU taxonomy.

In the US, Exxon and Chevron have closer to 10% of capital spending in 2025 that is being directed towards low-carbon energy solutions. Exxon is pursuing opportunities in lithium, hydrogen, biofuels, and carbon capture and storage. Lithium is a relatively new addition to this list, with the company developing lithium deposits in Arkansas, and first production is expected in 2027. By 2030, Exxon states the ambition to produce enough lithium to supply the manufacturing needs of around 1m EVs per year. Exxon expects a further 10% of its capital spending to be on reducing emissions in its existing facilities, to support the company’s 2030 greenhouse gas emission reduction plans. Chevron’s New Energies business focuses instead on renewable fuels. Renewable fuel volumes are expected to treble by 2025, with the ambition of producing 100k b/day of renewable diesel and sustainable aviation fuel by 2030 (supported by its recent acquisition of Renewable Energy Group). The company is also investing in two of the world's largest carbon dioxide injection projects: the Quest CCS project in the Canadian oil sands and the Gorgon Project in Australia.

For all the interest around big oils and their potential transition to renewable and other low-carbon technologies, we must recognise that it will be a long journey. Even with the scale of Total’s plans, for example, we estimate that only around 20-25% of the company’s enterprise value in 2030 will be represented by its low-carbon business. That said, the value of low-carbon businesses for some of Europe’s smaller integrateds is already meaningful. Over 20% of Repsol’s enterprise value is already estimated to be in low-carbon businesses, for example, something we think the market gives little credit for.

Will Riley & Jonathan Waghorn 

January 2024

Risk: The Guinness Global Energy Fund and WS Guinness Global Energy Fund are equity funds. Investors should be willing and able to assume the risks of equity investing.  The value of an investment and the income from it can fall as well as rise as a result of market and currency movement; you may not get back the amount originally invested. The Funds are actively managed with the MSCI World Energy Index used as a comparator benchmark only. 

The commentary, which can be accessed via the article links above and below, contains important information about the Funds and further details on the risk factors are included in the Funds’ documentation, available on our website (guinnessgi.com/literature)

Disclaimer: This Insight may provide information about Fund portfolios, including recent activity and performance and may contains facts relating to equity markets and our own interpretation. Any investment decision should take account of the subjectivity of the comments contained in the report. This Insight is provided for information only and all the information contained in it is believed to be reliable but may be inaccurate or incomplete; any opinions stated are honestly held at the time of writing but are not guaranteed. The contents of this Insight should not therefore be relied upon. It should not be taken as a recommendation to make an investment in the Funds or to buy or sell individual securities, nor does it constitute an offer for sale. 


Download article
Download article