Global Energy Outlook 2025

Portfolio Manager, Specialist Team

Portfolio Manager, Specialist Team

2024 IN REVIEW
Weaker global oil demand growth, particularly from China, required OPEC+ to continue its oil market micromanagement to maintain reasonable prices. Oil prices were fairly stable, trading in a $70-90/bl range and averaging $80/bl, a level which coincides with the long-term incentive price and the ‘floor’ which Saudi are seeking.
Strong Asian gas demand and liquefied natural gas (LNG) supply disruptions kept the gas market tighter than expected, while the loss of further Russian gas meant Europe competed for global LNG in the second half, strengthening prices further. Oil and gas equities underperformed the broader market in 2024, despite attractive yields.
The dominant themes for global oil and gas markets last year were:
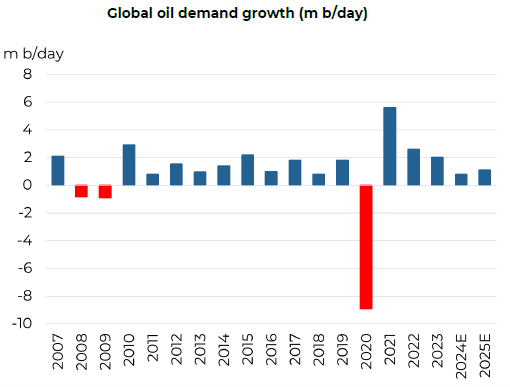
Weaker oil demand, up by 0.8m b/day vs 2023. Actual 2024 demand of 102.8m b/day was in line with initial expectations but growth of 0.8m b/day was lower than expected as historic 2023 demand data was revised upwards.
Source: IEA; Guinness Global Investors
Chinese demand grew by 0.2m b/day as weakness in gasoil, distillate and fuel oil (used in industrial activities and property construction, and reflective of the weakness in China’s economy) was offset by strength in petrochemicals. Globally, within the demand mix, petrochemical feedstocks, including ethane and naphtha, are proving to be key growth drivers.
2024 was another year of careful oil market micromanagement by OPEC+ and the group twice delayed plans to add withheld oil back into the market. Within OPEC+, Iranian production grew around 0.4m b/day, Venezuela grew 0.1m b/day while Russia and Kuwait cut by 0.4m b/day and 0.1m b/day respectively.
Towards the end of the year, Saudi pushed members for greater quota compliance. OPEC’s actions appeared to be defending a Brent oil price of $80/bl+, a level which, in real terms, the group have defended several times before over the past twenty years.
Outside OPEC+, we saw supply growth from US (shale and non-shale), Guyana and Canada. US shale oil likely grew by around 0.4m b/day as the US exploration and production (E&P) industry persisted in its focus on free cashflow yields, deleveraging and increasing returns to shareholders.
Guyana delivered new projects (+0.2m b/day) and Canada benefitted from new pipeline access (+0.2m b/day), but Brazil disappointed with flat annual output in 2024, much lower than the forecast 0.3m b/day of growth. Robust non-OPEC+ production in 2024 reflected high-quality execution of new projects and a slowdown in industry decline rates.
Natural gas markets tightened during the year after a weak start caused by a mild northern hemisphere winter. Weakness in prices (US Henry Hub below $2/mcf) catalysed a demand recovery with global LNG demand (ex-Europe) growing around 10% (more than the prior three years combined) while unplanned LNG maintenance, new project delays and Russian sanctions kept the global market tighter than anticipated. The loss of further Russian pipeline gas via Ukraine, low winds speeds and cold weather kept European prices strong into year end, ending at $15/mcf.
The generally muted oil and gas price environment combined with strength in other equity sectors caused energy equities to underperform the broad market in 2024 despite high free cash flow and dividend yields.
The sector (MSCI World Energy Index) finished +2.7%, behind the broad market (MSCI World +18.7%) in USD. The year saw outperformance from North American equities (especially large-cap integrateds, midstream and gassy-E&Ps), whilst European large-cap integrateds were weaker, together with refiners and oil services.
OUTLOOK FOR 2025
Another year of OPEC+ micromanagement of the oil market is expected in 2025. Global oil demand growth of around 1.1m b/day will be exceeded by a combination of US, Guyana, Brazil, Canada and other OPEC+ production growth, requiring OPEC+ to focus on quota compliance in order to achieve a balanced market.
The arrival of President Trump and the threat of further Middle East tensions could easily reduce global oil supply and give room for OPEC to return withheld oil to the market, although likely later than 1Q 2025. We believe the oil price desired by OPEC is at around $80/bl and, just as in 2024, that they continue to be committed to providing a balanced market. By contrast, we see energy equities currently reflecting a long-term oil price of around $65/bl, implying good valuation upside.
Oil demand growth is likely to be around 1.1m b/day (reaching 103.9m b/day) with the non-OECD +1.2m b/day and the OECD -0.1m b/day. Unlike previous years, China (at +0.2m b/day) will not be the key driver of demand growth.
At $80/bl Brent, oil remains highly affordable, with it representing 2.7% of 2025 world GDP (well below the 3.8% seen in 2010 when oil last averaged $80/bl). Hence, we continue to see global oil demand growing until around 2030, reaching a peak around 105-110m b/day.
World oil demand 1990 – 2040E versus oil demand pre-EVs
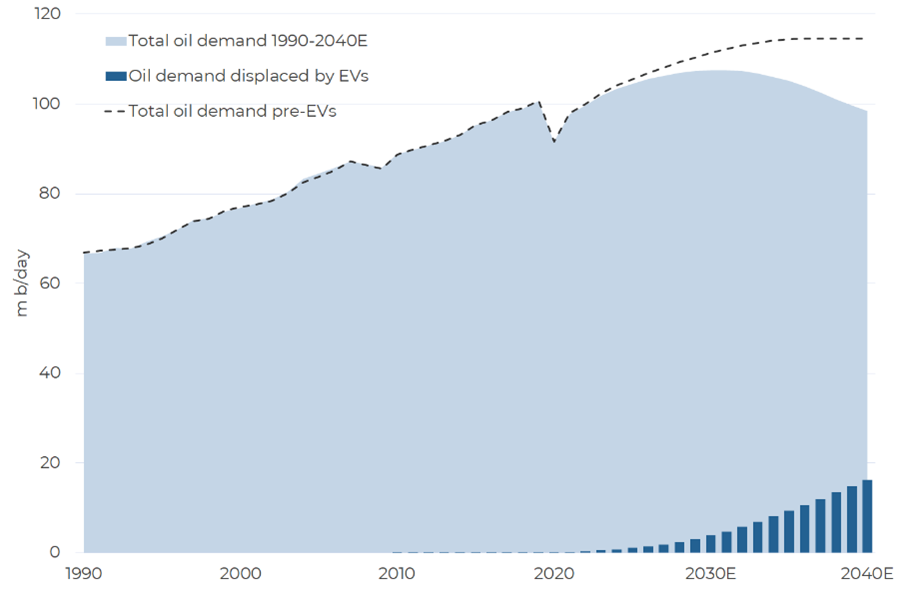
Source: BP Statistical Review for historic data; Guinness Global Investors estimates
OPEC+ will focus on quota compliance and micro-management to maintain a balanced market, allowing them room to start adding withheld oil back into the market if other supply disruptions occur. OPEC+ will keep a close eye on President Trump’s policy proposals, from the impact on oil supply (caused by his approach to Iranian sanctions) through to the impact of proposed tariffs on China, Canada and Mexico.
Overall, we believe that Saudi’s long-term objective remains to maintain a ‘good’ oil price, as close to their fiscal breakeven of around $96/bl as possible. Defending an $80 oil price in 2025 would be broadly the same in real terms as the group’s actions in 2006-2008 when they defended a nominal price of around $60/bl.
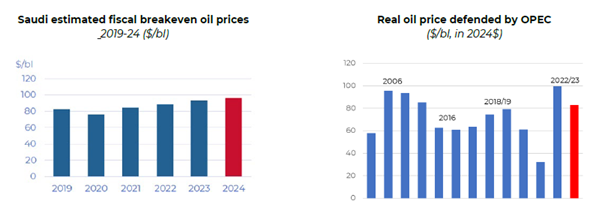
Sources: IMF; DNB, Guinness Global Investors Dec 2024. *’Breakeven oil price’ is defined as the oil price needed by Saudi to balance its fiscal budget.
Non-OPEC+ growth to continue although US shale production growth will slow to 0.3m b/day as capital discipline trumps any efforts from the new US President to increase supply growth. Brazil, Guyana, Canada and other non-US shale activities will be the key areas of other non-OPEC+ growth.
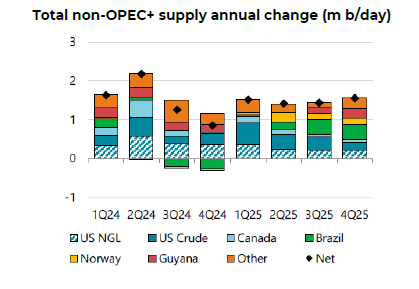
Source: IEA
Global natural gas markets remain in fine balance in 2025 US gas demand will grow around 4 Bcf/day in 2025 due to power generation demand and rising LNG exports but new supply is available and economic.
Longer-term, more US gas will be needed to satisfy growing AI and data centre demand. Asian gas demand, the role of Russia and the delivery of new LNG projects will define the international gas market in 2025.
Energy equity valuations remain attractive with the MSCI World Energy Index on a price to book ratio of 1.7x, versus the S&P500 at 5.1x. The relative P/B of energy vs the S&P500 remains more than two standard deviations below the long-term relationship.
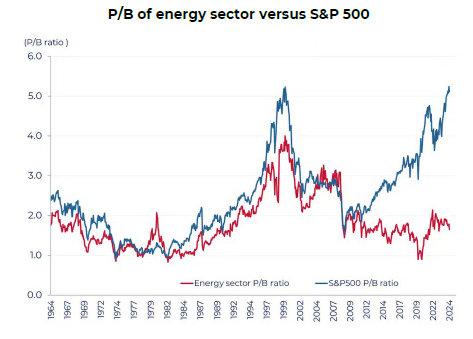
Sources: Bernstein; Bloomberg; Guinness Global Investors, 31.12.2024
Most oil and gas companies continue to promote capital discipline over organic growth, manifested in lower levels of debt and a return of free cash to shareholders. Assuming a $80/bl Brent oil price, we forecast an average free cashflow yield for our portfolio in 2025 of around 10.2%.
Energy equities offer good upside if our oil price, profitability and free cashflow scenarios play out. We believe energy equities currently discount an oil price of around $65/bl. Adopting $80/bl Brent as a long-term oil price, we see around 40% upside across the energy complex, on a one year forward basis.
Learn more about the Guinness Global Energy Fund
Risk: The Guinness Global Energy Fund and WS Guinness Global Energy Fund are equity funds. Investors should be willing and able to assume the risks of equity investing. The value of an investment and the income from it can fall as well as rise as a result of market and currency movement; you may not get back the amount originally invested. The Funds are actively managed with the MSCI World Energy Index used as a comparator benchmark only.
The commentary, which can be accessed via the article links above, contains important information about the Funds and further details on the risk factors are included in the Funds’ documentation, available on our website (guinnessgi.com/literature)
Disclaimer
This Insight may provide information about Fund portfolios, including recent activity and performance and may contain facts relating to equity markets and our own interpretation. Any investment decision should take account of the subjectivity of the comments contained in the report. This Insight is provided for information only and all the information contained in it is believed to be reliable but may be inaccurate or incomplete; any opinions stated are honestly held at the time of writing but are not guaranteed. The contents of this Insight should not therefore be relied upon. It should not be taken as a recommendation to make an investment in the Funds or to buy or sell individual securities, nor does it constitute an offer for sale.