Global Energy - April Commentary

Jonathan Waghorn Portfolio Manager, Specialist Team
/

Will Riley Portfolio Manager, Specialist Team
This is a marketing communication. Please refer to the prospectus, supplement and KID/KIID for the Funds before making any final investment decisions. The value of this investment can fall as well as rise as a result of market and currency fluctuations. You may not get back the amount you invested.
Past performance does not predict future returns.
Global energy equities outperformed the broader market over the first quarter of 2025, as oil prices remained robust and the companies delivered consistent messages around cost control and free cash generation with less focus on low carbon energy investments. Here, we explore the key developments in energy markets and the fund over the period and consider the outlook.
Over the first three months of 2025, we saw developing expectations of a tighter oil market for the rest of the year. The tighter oil balance has been driven by lower supply expectations, amplified by heightened geopolitical tensions in the Middle East and Russia and moderated by the threat of geopolitically related demand weakness. The Brent spot oil price has averaged $75/bl since the start of the year, whilst the five-year forward Brent oil price has averaged nearly $68/bl.
Brent spot price vs 5 year forward price ($/bl), 6mths to March 2025
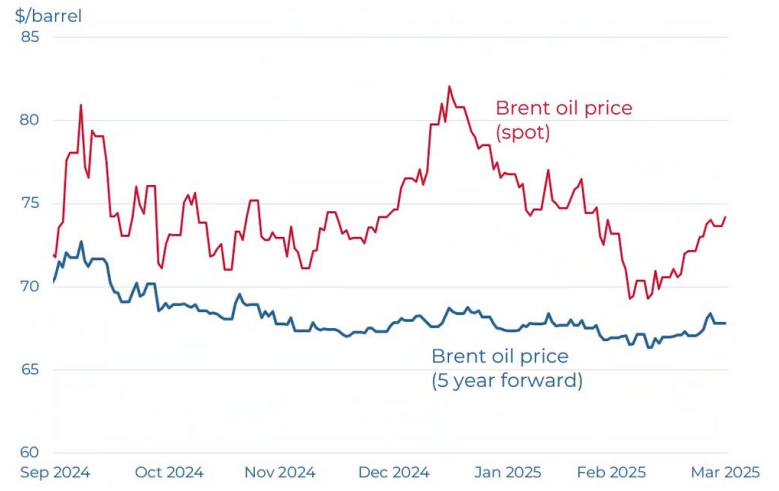
Source: Bloomberg; Guinness Global Investors; data as of 31.03.2025
Global oil demand growth for 2025 is estimated by the IEA to be 1.0m b/day (down slightly from the 1.1m b/day forecast at the start of the year but ahead of the 0.8m b/day growth seen in 2024) with the non-OECD up by 1.1m b/day and the OECD down by 0.1m b/day. The demand outlook has been impacted by geopolitical risks, especially the threat of tariffs from President Trump, leading the IEA to note in its most recent Oil Market Report that “amid an unusually uncertain macroeconomic outlook, recent delivery data have been somewhat underwhelming”.
Oil demand in 2025 of 103.9m b/day (unchanged from expectations at the start of the year) will be around 3.3m b/day above its previous peak in 2019. Unlike previous years, China is not expected to be the key driver of demand growth and at only 0.2m b/day, China’s demand growth is in line with that expected from India, Other Asia and the Middle East.
When writing at the start of the year about the prospects for oil demand, we placed strong emphasis on the current affordability of oil as a driver of demand upgrades. Globally, we believe that oil remains a ‘good value’ commodity. Based on Brent oil price of around $80/bl in 2025, we calculate that the world would spend around 2.7% of GDP on oil, below the 30-year average of around 3% and well below the 3.8% seen in 2010 when oil also averaged $80/bl.
The world oil ‘bill’ as a percentage of world GDP
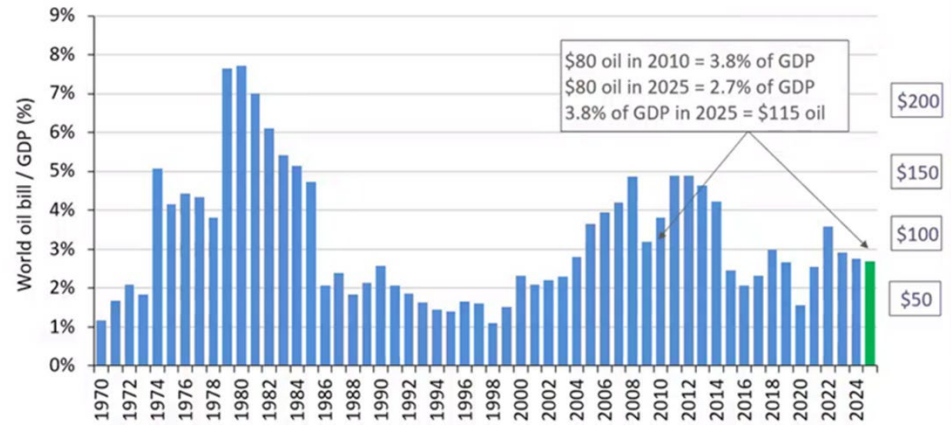
Source: Bloomberg; Guinness Global Investors; data as of 31.12.2024
On the supply side, forecasts for non-OPEC supply growth in 2025 have moderated by 0.2m b/day since the start of the year, although some of this reduction was related to very cold weather conditions affecting production in the United States. Nonetheless, the call on OPEC and OPEC+ production for the year has increased and, after a number of quarters of delays, OPEC+ confirmed plans in March to increase production monthly (by 140,000 b/day), starting in April. The oil to be added back into the market comes from a group of eight countries within OPEC+ (Saudi included), who have provided voluntary production cuts over the last two years, above formal quota adjustments.
Later in the month, the group announced stricter plans for its members to compensate for historic levels of overproduction (or non-compliance with quotas) with lower production in future months. The net effect of the two announcements is expected to be a small shorter term tightening of oil supply/demand as the compensation cuts are forecast to outweigh the return of withheld supply. OPEC+ continued to stress that its supply strategy could be amended at any time, should market conditions require it.
Geopolitical concerns persisted, dominated by the actions of the United States with respect to Russia, China, Iran and Venezuela. Early in February, incoming US President Donald Trump signed an executive order requiring the US Treasury Secretary to impose "maximum economic pressure" on Iran. The move is a return to the approach he took during his last presidency, which caused Iranian exports to fall by around 2m b/day. Later in the quarter, the US put sanctions on a Chinese refinery (that represented a large share of the 1.6m b/d of Iranian oil that China imported in 2024) and carried out air strikes against the Houthi rebels in Yemen.
Iranian oil exports
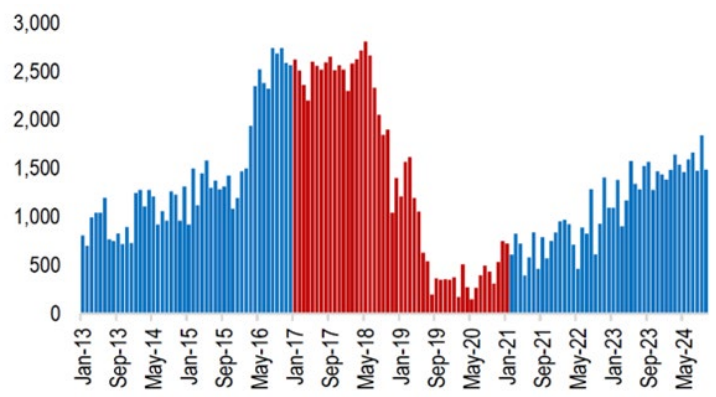
Source: JP Morgan, Kpler; data as of 31.12.2024
Earlier in the quarter, the US placed new sanctions on Russian oil producers Gazprom Neft and Surgutneftegas (representing 2m b/day of production and 1m b/day of exports) as well as a Chinese port operator and a large number of crude oil or oil product tankers that previously carried Russian and Iranian crude oil. The US also announced the cancellation of a “concession agreement” in Venezuela that allowed Chevron to produce export oil from the country. The concession had been put in place by President Biden in November 2022 and, since then, Venezuelan oil production has increased from 0.7m b/day to nearly 1.0m b/day. Seaborne crude oil exports are already starting to fall (-11.5% in March vs February) and we expect further declines in coming months.
As these actions have shown, we believe that Trump will have more of an impact on international oil markets in 2025 than he can have on his own domestic oil market. His actions in 2025 could negatively impact supply from Russia, Venezuela and Iran and create sufficient space for OPEC+ to return some of their withheld volumes back to the market, in line with its current strategy.
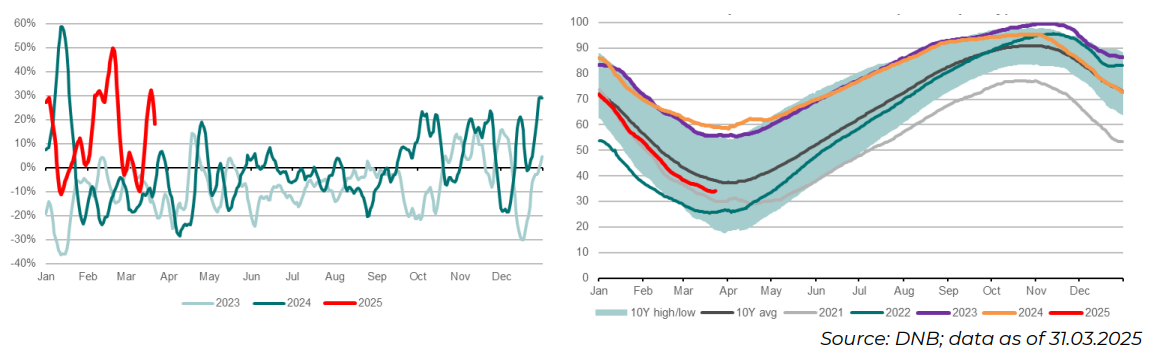
International and US natural gas markets remained tighter than expected in 2025, thanks largely to industrial, LNG and power demand for natural gas together with colder than normal conditions (the US suffered the coldest January in a decade). US natural gas inventories drew to 9% below 10-year average levels as the first phase of the Plaquemines LNG terminal commenced operation, consuming 2 Bcf/day of natural gas (nearly 2% of total US gas demand) and helping to lift the Henry Hub gas price to over $4/mcf at the end of March. Milder weather allowed inventories to rebuild in the second half of March.
Similar tightening occurred in Europe where a combination of reduced Russian gas imports, colder weather, lower wind power and increased competition from Asia for LNG brought the largest winter drawdown in gas inventories in four years (falling to 33% full, 10ppts below the 5-year average level). This was in sharp contrast to the prior 24-month period during which Europe had been successful in building a surplus of natural gas in storage (preparing itself for higher demand winter periods). Returning inventories to 90% by the end of the injection season (October) will require an estimated 250 extra LNG cargoes.
European gas demand (7 day moving average change yoy) and natural gas inventories (% of capacity)
In terms of company news during the quarter, the BP strategy day highlighted a reset back towards growth in fossil fuels (at the expense of low carbon activities) while Shell showcased an attractive long-term outlook for LNG demand.
In the opening comments of his strategy day presentation, bp CEO Murray Auchincloss stated conviction that “energy demand is growing over the next decade and beyond” and that “the world is in an ‘energy addition’ phase, consuming increasing amounts of both fossil fuels and low carbon energy”. Informing the decision to return to fossil fuel growth, bp believes that “oil and gas will be needed for decades to come” with oil and gas demand robust out to 2035, including strong growth in natural gas demand from emerging Asian economies (a point well covered in Shell’s LNG event). As such, BP acknowledged its push into renewables over the last five years had been “too far, too fast” and the company announced plans to cut low carbon capex by nearly 80%.
For companies operating in the key sectors held in our Global Energy Fund, the consistent themes being reported were operating cost control, free cash generation and capital expenditure restraint (with a bias away from low carbon activities). Within the fund over the quarter, strongest performers included:
- European Integrateds: seven of the top ten contributors were European integrateds, reflecting strength in broader European stock markets and a tilting away from low carbon investments back towards growth from fossil fuels
- US super majors: Exxon and Chevron were top ten performers as they delivered strong results and free cash flow generation and, accordingly, provided a safe haven opportunity for investors in US markets
- US refining: tighter refining capacity kept refining margins higher. Particular beneficiaries included Valero Energy and US major, Exxon.
Sectors in the portfolio that were relatively weaker over the quarter included:
- Canadian integrateds: Despite Canadian oil benchmarks strengthening versus WTI, our Canadian integrateds were generally weaker as a result of tariff concerns
- Services: Large cap diversified service companies Halliburton and Baker Hughes underperformed, driven by a flat US oil/gas rig count and continued capital discipline from E&Ps and integrated oil.
mported in 2024) and carried out air strikes against the Houthi rebels in Yemen.
Guinness Global Energy fund contribution 1Q 2025
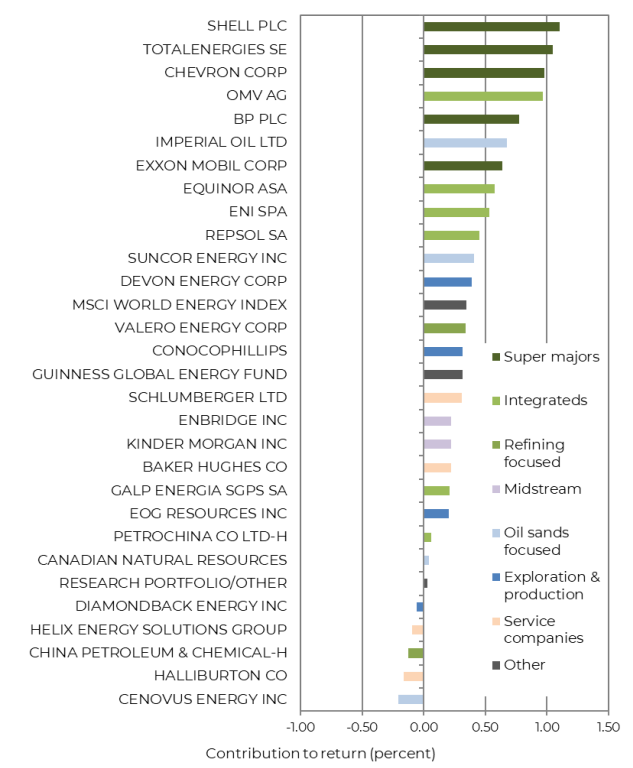
Source: Bloomberg, Guinness estimates; data as of 31.03.2025
Moves in energy equities lifted the price-to-book (P/B) ratio for the energy sector at the end of March 2025 to around 1.8x, versus the S&P 500 trading at 4.8x. On a relative P/B basis versus the S&P500, therefore, the valuation of energy equities now sits at around 0.38x (down from 0.51x at the end of 2022), and still more than two standard deviations below the long-term relationship.
P/B of energy sector versus S&P 500
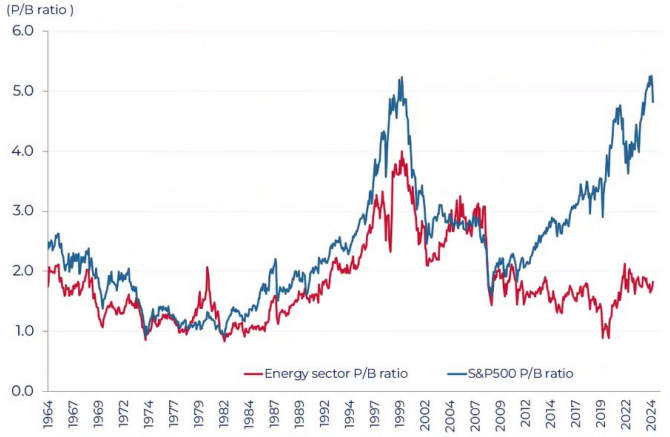
Sources: Bernstein; Bloomberg; Guinness Global Investors; data as of 31.03.2025
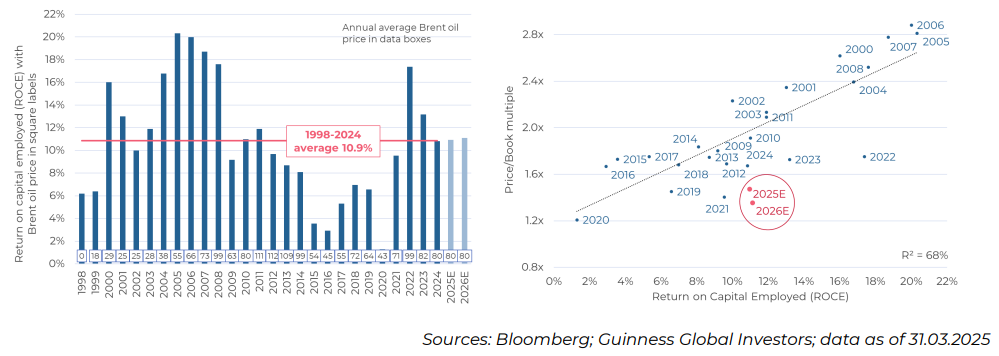
We keep a close eye on the relationship between the P/B ratio for the energy sector and its return on capital employed (ROCE) which, although having had a high correlation historically, has diverged since 2021. The divergence has closed somewhat year to date and potentially reflects a shift in market sentiment towards energy security and energy pragmatism at the expense of decarbonisation.
The bp and Shell events highlighted the attractive longer term demand outlook for oil and natural gas and they may help to support a re-rating of global energy equities as investors ascribe a more meaningful terminal value to oil and gas producers that provide growth within a disciplined cash flow framework.
With full year results now reflected, we see ROCE for the Guinness Global Energy portfolio in 2024 (with Brent oil averaging $80/bl) at around 10.8%, in line with the mid-cycle ROCE which we peg at 10.9%. With the Brent oil price averaging around $80/bl in 2025, we see ROCE at around 11.0%, a level that we expect to be maintained in 2026 with Brent at the same level.
Current P/B valuation implies that the long-term ROCE of our companies should average only around 3%, significantly below the mid cycle or long-term average level of nearly 11%. If ROCE remains at our 2025 forecast level of nearly 12%, and the market were to pay for it as it has done on average over the last 20 years, it would imply an increase in the equity valuation of around 35%.
Guinness Global Energy portfolio ROCE and P/B
The higher ROCE is being supported by robust free cash generation. Assuming an average Brent oil price of $80/bl in 2025, we estimate the free cashflow yield of our portfolio, after capital expenditure, to be around 9.8% and note that the 2025 estimated gross dividend yield of the portfolio currently sits at around 4.4%. Fixed dividends in the portfolio have generally been growing, and have ample room to run further, given the high free cashflow yield.
The stronger free cash generation has helped the industry to shrink its outstanding debt. The main holdings in the Guinness Global Energy Fund now have average net debt/EBITDA at around 1.0x in 2025, assuming $80/bl Brent. This is lower than the 1.5x average of the last 20 years, reflecting management focus on maintaining healthier balance sheets. In 2025, it would take a reduction in EBITDA of nearly 50% to see net debt/EBITDA levels to get back to the 20-year average and a reduction of 75% to get back to the peak net debt/EBITDA levels seen in 2015.
Net debt/EBITDA for current Guinness Global Energy Fund holdings
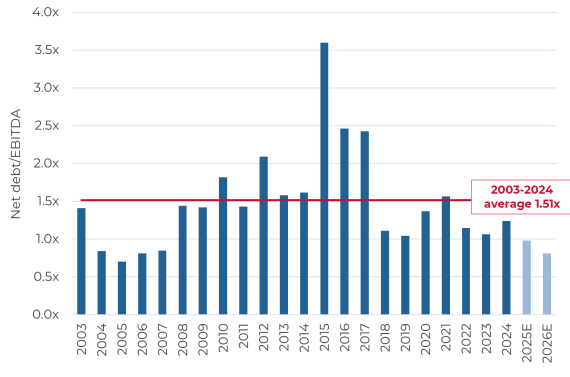
Source: Guinness Global Investors, data as of 31.03.2025
To consider valuation another way, we are often asked what oil price is implied in the portfolio, as a barometer of the expectation priced into the equities. At the end of March, we estimate that the valuation of our portfolio of energy equities reflected a long-term Brent/WTI oil price of around $68/bl. If the market were to price in a long-term oil price of $75/bl, it would imply around 25% upside while there would be around 55% upside at a long-term oil price of $85/bl Brent.
Upside/downside for Guinness energy portfolio (1 year forward view)
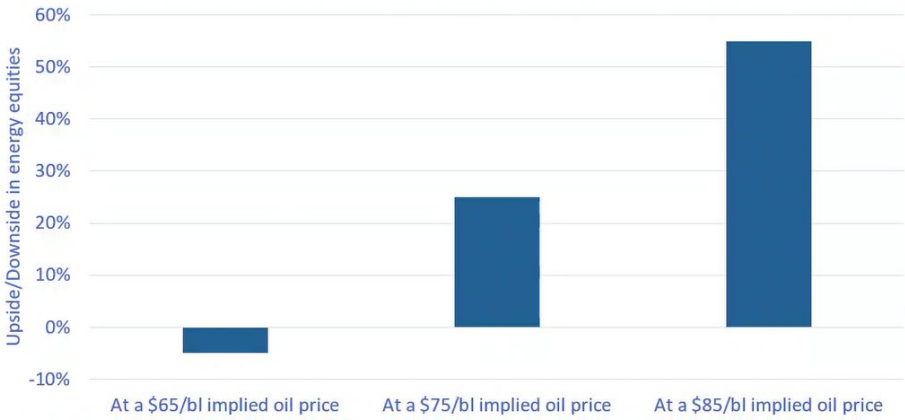
Source: Guinness Global Investors; data as of 31.03.2025
In summary, at $80/bl Brent in 2025, our portfolio continues to trade at a significant valuation discount to the broader equity market, despite high shareholder return yields. We see good confidence that dividends can continue to increase and will be supplemented by share buyback programmes, all driven by a free cash flow yield of around 10% for the portfolio, much higher than the 3.5% seen in the portfolio over the last twenty years.
Learn more about Guinness Global Energy

Guinness Global Energy

Latest Factsheet
Guinness Global Energy - Webcast
The information provided on this page is for informational purposes only. While we believe it to be reliable, it may be inaccurate or incomplete. Any opinions stated are honestly held at the time of publication, but are not guaranteed and should therefore not be relied upon. This content should not be relied upon as financial advice or a recommendation to invest in the Funds or to buy or sell individual securities, nor does it constitute an offer for sale. Full details on Ongoing Charges Figures (OCFs) for all share classes are available here.
The Guinness Global Energy Funds invest in listed equities of companies engaged in the exploration, production and distribution of oil, gas and other energy sources. We believe that over the next twenty years the combined effects of population growth, developing world industrialisation and diminishing fossil fuel supplies will force energy prices higher and generate growing profits for energy companies. The Funds are actively managed and use the MSCI World Energy Index as a comparator benchmark only.
For the avoidance of doubt, if you decide to invest, you will be buying units/shares in the Fund and will not be investing directly in the underlying assets of the Fund
Documentation
The documentation needed to make an investment, including the Prospectus, the Key Information Document (KID) / Key Investor Information Document (KIID) and the Application Form, is available from the website www.guinnessgi.com, or free of charge from:
- the Manager: Waystone Management Company (IE) Limited (Waystone IE), 2nd Floor 35 Shelbourne Road, Ballsbridge, Dublin DO4 A4E0; or,
- the Promoter and Investment Manager: Guinness Asset Management Ltd, 18 Smith Square, London SW1P 3HZ.
Waystone IE is a company incorporated under the laws of Ireland having its registered office at 35 Shelbourne Rd, Ballsbridge, Dublin, D04 A4E0 Ireland, which is authorised by the Central Bank of Ireland, has appointed Guinness Asset Management Ltd as Investment Manager to this fund, and as Manager has the right to terminate the arrangements made for the marketing of funds in accordance with the UCITS Directive.
Investor Rights
A summary of investor rights in English, including collective redress mechanisms, is available here: https://www.waystone.com/waystone-policies/
Residency
In countries where the Funds are not registered for sale or in any other circumstances where their distribution is not authorised or is unlawful, the Funds should not be distributed to resident Retail Clients. NOTE: THIS INVESTMENT IS NOT FOR SALE TO U.S. PERSONS.
Structure & Regulation
The Fund is a sub-fund of Guinness Asset Management Funds PLC, an open-ended umbrella-type investment company, incorporated in Ireland and authorised and supervised by the Central Bank of Ireland, which operates under EU legislation. The Fund has been approved by the Financial Conduct Authority for sale in the UK. If you are in any doubt about the suitability of investing in the Fund, please consult your investment or other professional adviser.
WS Guinness Global Energy Fund
Documentation
The documentation needed to make an investment, including the Prospectus, the Key Investor Information Document (KIID) and the Application Form, is available in English from https://www.waystone.com/our-funds/waystone-fund-services-uk-limited/ or free of charge from:-
Waystone Management (UK) Limited, PO Box 389, Darlington DL1 9UF.
General enquiries: 0345 922 0044
E-Mail: iwtas-investorservices@waystone.com
Waystone Management (UK) Limited is authorised and regulated by the Financial Conduct Authority.
Residency
In countries where the Fund is not registered for sale or in any other circumstances where its distribution is not authorised or is unlawful, the Fund should not be distributed to resident Retail Clients.
Structure & regulation
The Fund is an Authorised Unit Trust authorised by the Financial Conduct Authority.